Lucidchart Review
I have discovered perhaps my favourite piece of software. Lucidchart
Lucidchart is a web-based, HTML 5 diagramming solution, for collaborative and personal use. It can be used for all kinds of diagramming – Flowcharts, Wireframes, UML or Network diagrams, Mock ups, Business process, Mind maps Site maps, Org charts or Venn diagrams.
It’s social too (isn’t everything?), allowing real time contributions on a single file. It has a great UI, it’s packed with features and examples and it integrates with two of my favourite Agile tools – Jira and Google docs. Oh, and it’s free.
I find that one of the most interesting aspects of productivity improvement, is what can be gained through process review. So business process analysis is something I actually enjoy and my love for a flowchart is a bit of an in-joke around the office.
For years, my favourite tool for the creation of flowcharts has been yEd. This is a brilliant Java-based freebie that runs on your PC, or my Mac. It’s actively in development, and updates are frequent, which has provided me a stream of new features and improvements over a very long time now. I’ve come to rely upon it as a lightweight Visio replacement.
These days however, it’s all about the cloud. I’ve lately been assembling some process documentation using Google docs. The great thing about Google docs for this purpose is that one is able to create a living document, which when shared appropriately, provides access to the latest information required by the viewer. I make an update, and the versioning is done. No need toe check-in or check out any working files, and interested parties can even be notified immediately of the change. One doc, one location, one reference for all.
But what if I want to include a diagram? In an age that allows me to work in the way I just described, does it makes sense to keep a local copy of a diagram file on my computer, uploading that file for replacement in the Google Doc everytime I edit it? Nope.
Enter Lucidchart.
I have tried other online diagramming tools over the time. I’ve never stuck with any of them, for one of two reasons.
- They do not allow me to share a read-only version of a diagram that is updated in real time
- I have not enjoyed the experience of creating the charts themselves because the interface is too slow or complicated.
For the purposes of my shared Google documentation, the first requirement is more important than the second. So I had settled with the Google docs own drawing solution for diagrams that needed to be included and updated live. Unfortunately, making a flowchart with Google drawings is less fun than the dentist.
The Lucidchart UI is as close to perfect as I could imagine. Now I realise that’s a big statement, and that ratings of user interface are very subjective, but for me, it doesn’t get much better.
Once logged in there is a quasi-filing system, where your diagrams are . You can make a new diagram easily from scratch or from some preconfigured templates. There’s even a way to share your diagrams as templates with others, if you think you just diagrammed the answer to world peace.
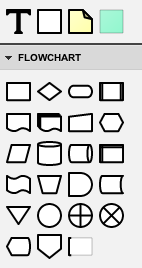
After you’ve created a diagram and begin laying things out, the fun really starts. All of the usual charting component are present, waiting to be dragged into your masterpiece. They are grouped into sections, so that you can make flowchart (or whatever) like an expert.
Colouring and labelling each new chart node is easy and items can be grouped together for bulk relocation etc.
The real shining light in Lucidchart though, is when it comes to joining the dots. You can choose from either straight line, right angle joiners with arrow points and independent labels if you desire or use the more free-flowing visual appeal of an editable vector curve to connect two items. Neat overlapping of lines is automatic, and the joiners travel and readjust themselves if you reposition the items at either end.
You can use Lucidchart for free, with limited complexity in your files (60 items per diagram). After that, you need one of their paid accounts which are based around integration acess and the number of users in your gang.
Google docs integration
One of the pillars of Lucidcharts , was the insistence that it be easy to reuse the charts outside of the website. PDFs are very easy to export for example. For my Google docs usage, I can also save a HTML, fixed address webpage that I can link to. This shared version updates live as I work on the chart, so there’s no need for me to upload a new version. Here’s a bug handling process diagram as an example.
There’s even a way for businesses to integrate Lucidchart directly with their Google Apps account for single sign-on.
I’ve only used Lucidchart for a little while now, and I might be the last person in the world to catch on. Its very clear to me that what I’ve asked of it so far only scratches the surface of its capabilities. The other portions of the tool that I’ve briefly explored seem to offer a similar level of usability and simplicity, so it’s easy to see myself expanding my reliance on my new best friend.
You should try it too, because it’s so bloody cool, you need it.
NOTE – This post was written as an independent review and remains so, unedited in its original form. As of 2017, when you join Lucidchart from links on this site, a product a small percentage of the purchase price comes back to Scrumage.com . It’s this money that helps pay towards website hosting and other running costs.


+ There are no comments
Add yours