Free Agile Chart Templates – Agile Charts (Part 3)
Ok, I promise this will be my last charting post!
I’ve devoted my last 2 Agile posts to the use of charts in Agile projects, discussing several kinds of charts and how they can bring a greater understanding of team performance/practices, how they can communicate progress externally and expose phase inefficiencies or ballooning scope.
But how to create them?
I’ve tried dozens of Agile software tools, each one providing an interface for backlog management, sprint or throughput management and (occasionally) reporting. Reports are usually generated from data input or collected in the daily roundabout of development, and rarely to the suit my taste perfectly.
It’s not that hard really, charting. What I have usually felt is missing from the system derived “auto charts” is a basic flexibility, and like a lot of development managers, I’ve found myself coming back to spreadsheets.
That doesn’t mean I’m a dinosaur though. If you don’t mind, I’d like it if you read the next line aloud, using the voice of a circus spruiker.
“Ladies and Gentlemen, (drum roll) I present for you, my Google Spreadsheet Templates for the Management of Agile Projects!”
Alright alright, hardly the world’s strongest man, but prettier than the bearded/tattooed lady, and they’ll save you a lot of time. These really have taken me a few years to devise and groom.
There’s:
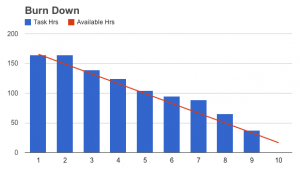
A Sprint Burn Down, Sprint Burn Up and Cumulative Flow HERE
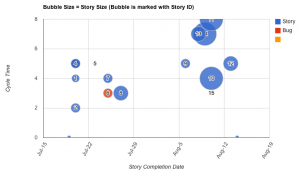
A Cycle Analysis series HERE
A Bug Tracker HERE
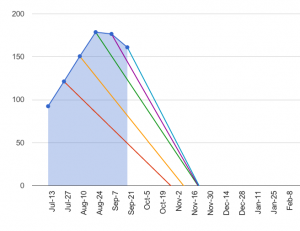
and my all time favourite, The Project Forecaster HERE
There are instructions inside each one, and you can copy, and then edit, share and build on them all you wish. I hope you find them useful. I’d love to hear from you if you do.


Been getting quite a few hits on the Google docs pages. I really want these charts to be a useful resource for people other than me, so please leave some feedback here!
ADFIT11 Going to try these out. Prepping for my new job. I like the forecast concept…does not seem to be working in Excel yet. Will have to play around to make it work…brilliant nonetheless.
Keep in touch with any problems Kyle, but the chart should work fine as you get the data in.
HI Adrian, I really enjoyed yor charting scrum session at the Scrum Australi conference. I am also a chart lover. I recall that you showed us the parking lot chart. Can you please tell me where I might find ta template for this one.
Hi Marion,
I’ll obtain or create a parking lot template as soon as I can, and post it here on the website.
Gday Adrian, I really enjoyed your talk at the scrum meeting last week.
The links that you have above which detail the instructions on how to complete I think have changed because it takes me through to a page that is seems to show it has changed. Can you update?
Hi Adrian,
Really enjoyed your talk at LAST on Friday,
I’ll try out these templates when I get back to work.
Now I just need to find out about Action boards
[…] to simulate projects with my teams. It’s a Google sheet with instructions and (as with all my charts) you can make a copy and use it as you […]
Gday Adrian,
Is there a shared video recording of your talk?
Hi Joris, it’s a long time ago, but this might be it!