
Agile Charts for MS Excel
Very short post to catch those interested up.
I have produced some regular old Excel versions of my agile charts for distribution. Here’s a download link.
Charts Download
What’s here?
Excel Agile Charts!
Easy data entry and instructions for the charts below. Each file has instructions on how to read, update and use each version.
These are for real world use and you can edit and alter them as you please. Suggestions for improvement and a link back here would be nice!
Go for it.
Bug Tracking Chart
![]()
Sprint Burn Down Chart
Sprint Burn Up Chart
Cumulative Flow Chart
SPC Chart (Cycle Time)
Cycle Time Chart
Estimation Accuracy Over Time Chart
Forecast Lighthouse Chart
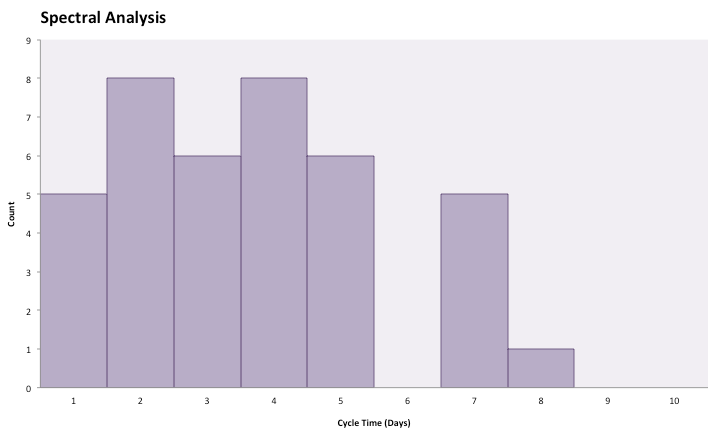
Spectral Analysis Chart
Time and Budget Chart (Earned value)
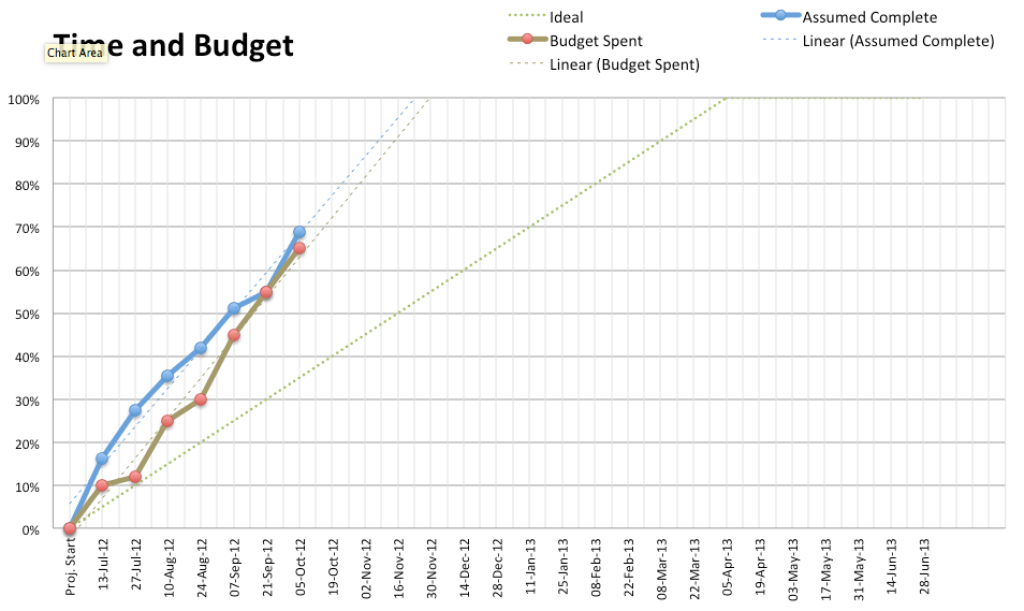
Have fun with these! Send me yours for inclusion and discussion here, and please suggest improvements. The more the better.

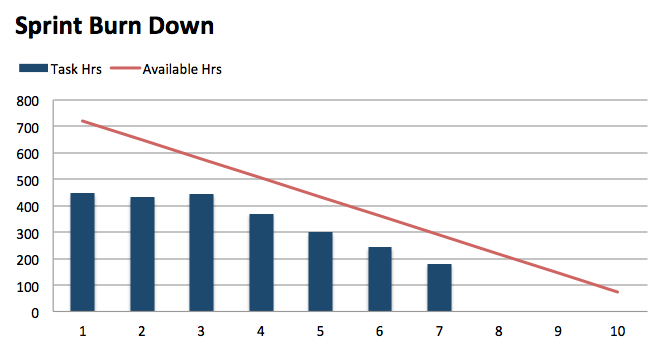
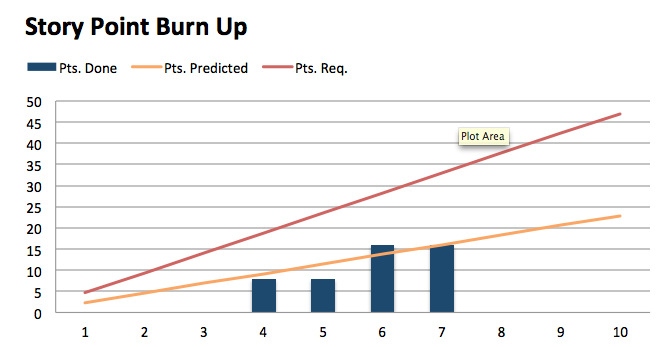
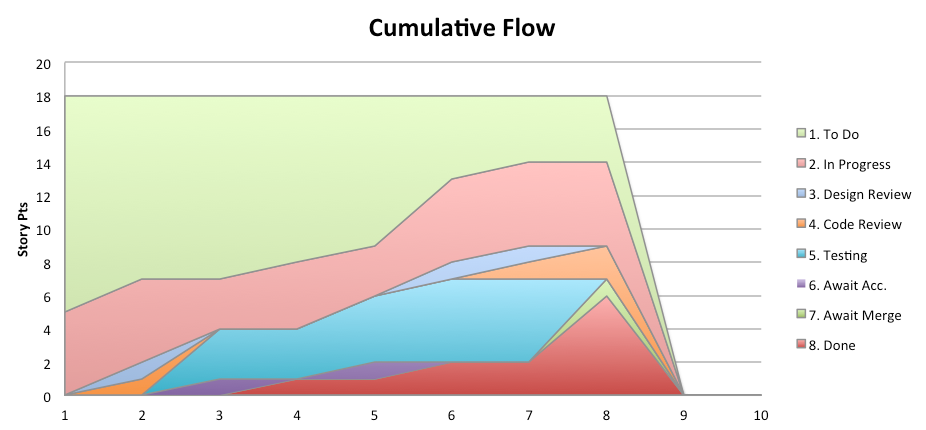
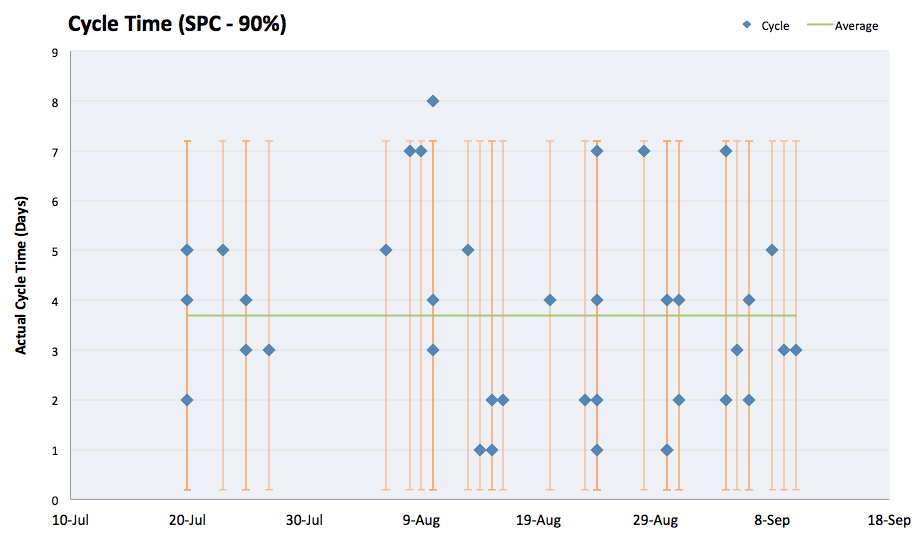
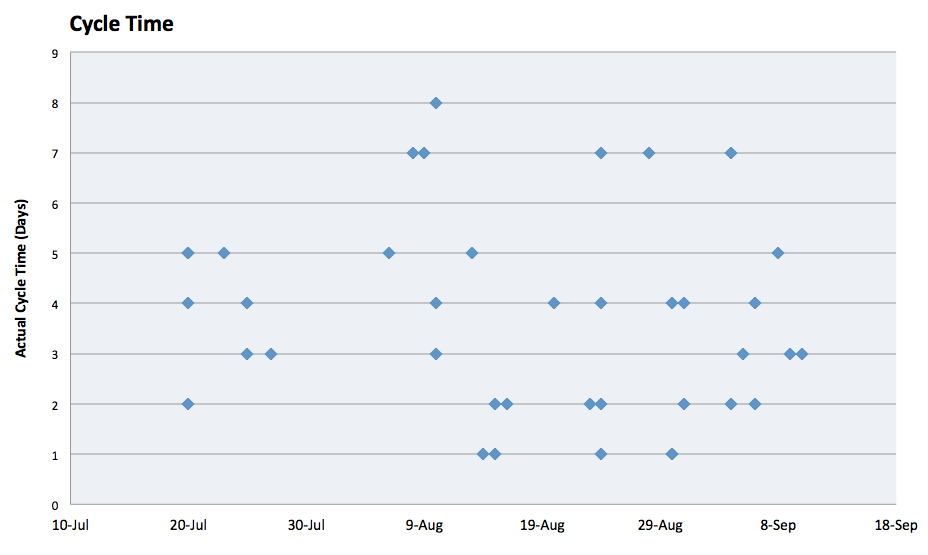
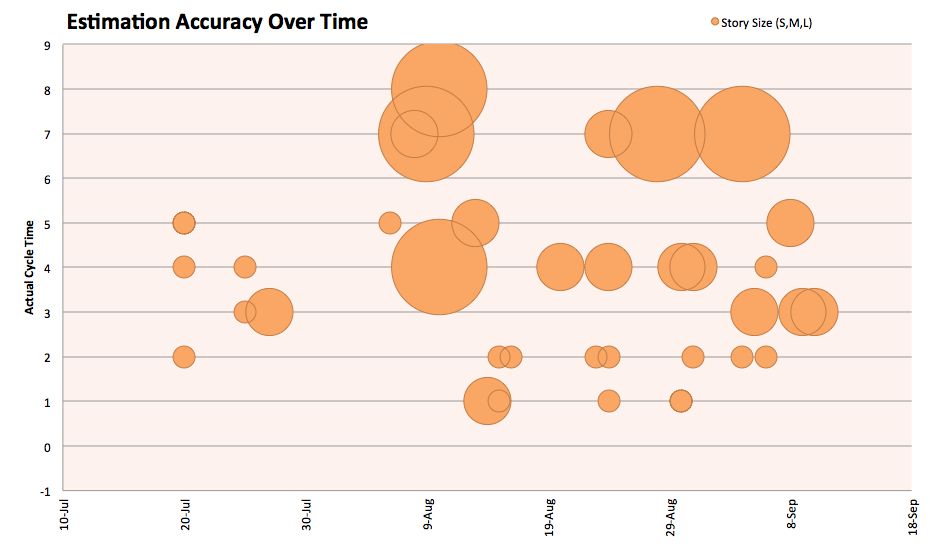
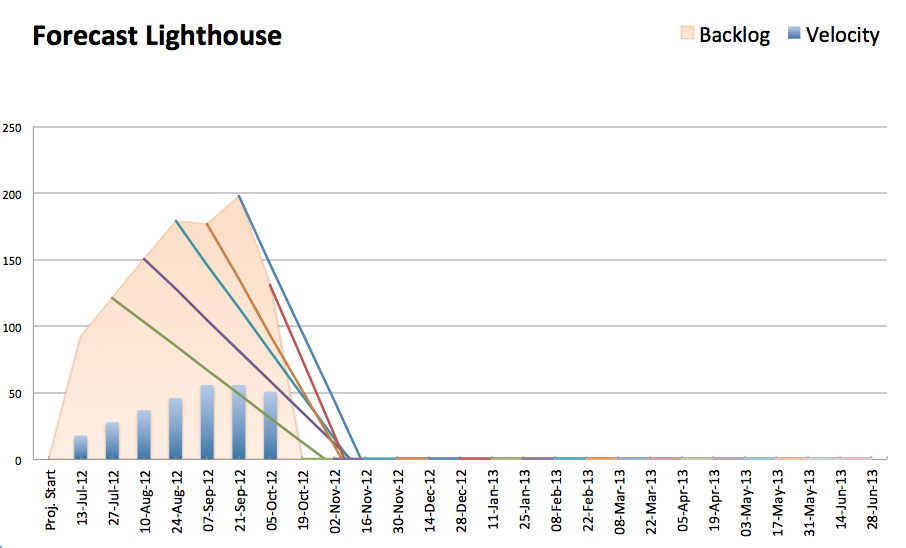
[…] All the above charts can be found on the presenter’s website here. […]
[…] Excel Agile Charts: https://scrumage.com/blog/2013/04/agile-charts-for-ms-excel/ […]
Thanks for this. Very helpful! I really like the cumulative chart.
Thanks for being so kind to share your work. Thanks so much and have a wonderful Holiday
Watch this space Rich. New charts on their way in 2015!
I seem to have issues getting a full download of the charts. I can get the “bug tracker” “burn down” “cycle time” and project forecast”. I thought I had downloaded the “burn up” chart, but it seems to be missing from the group. I would love to get my hands on it. These are great!
Hi Lynda, Burn Up is part of the “Sprint Burn Down Template (with instructions)” file in the ZIP file.
This is really cool Stuff. Thanks a ton for sharing your wonderful work…
I really loved the CFD and Bug Tracker
Forecast seems interesting let me try this one out.
One word AAAAMAZING
Thanks Fitto… awesome stuff and makes me miss the walkabouts and demopalooza!
[…] you upgrade your processes and increase your team’s efficiency. There are ways to track Agile metrics using Excel, but if you find that you need to do that you may just want to switch to dedicated software […]
I love the “Forecast Lighthouse Chart” and the “Time and Budget Chart”. Both really allow me to make better predictions and see potential problems early in the cycle. However, I’m wondering if there is a bug in the “Time and Budget Chart”. If I wind up having a sprint in which 0 points are completed (doesn’t happen often but does happen), the “Budget Spent” line moves appropriately (even if nothing was spent during that sprint) but the “Assumed Completed” line doesn’t update. I would expect that line to move horizontally (since no work was completed) but it doesn’t. When I complete points in my next sprint, it continues the line as if the 0 pointed sprint didn’t happen.
Hello,
this is probably an old thread… has there been an update to the Cycle time chart. I have some questions around the one I downloaded