

Agile Project Forecasting – The Monte Carlo Method
NOW WITH INFO-Q VIDEO!
InfoQ now has the talk I did on the Monte Carlo Method at Agile Australia (last year):


Oh no. Another guy who hates estimates?
No way!
But look back through the history of this blog and you’ll see a couple of ever-present threads.
- Teams (and a manager) looking for ways to improve their assessment of the time required to deliver a software project
- The idea that while it’s probably impossible, it doesn’t mean you shouldn’t try
There’s great value in the discussions needed to make such an assessment, to forecast a delivery schedule for a software project. To do so, the group must have agreed on how it will record it’s work, what that work is, what value it represents, what options there may be in the delivery of that value, and so on.
Ultimately and broadly though, I think the usefulness of a project forecast boils down to two main things.
- Having enough of an idea of the cost of delivery, in order to weigh that against the expected value derived from the effort
- Providing dependent and interested parties with a chance to organise around the release date
Agile teams have tended towards comparative estimation, based on an idea made popular by Mike Cohn. Comparative estimation done well is a wonderful facilitator of good team conversations, but it’s still an opinion, tied to the team’s analysis of the task at hand. So while it’s a really useful discussion tool, it is common to find within the resulting delivery forecasts those human traits of over optimism and a desire to please the reader. We always think we’ll be able to do it faster than we can and we always know that’s what people want to hear!
Another way
An alternative to this approach is one that takes an “external” view of a team’s history and makes a forecast based on probabilistic simulation.
In this post, I’m going to step through such an approach, one that I’ve been using with teams, to build a better picture of the likely delivery timeline of a medium-sized project. The idea uses Takt Time and mathematic Monte Carlo estimation method to determine a probable range of delivery dates.
Takt Time
Takt is a German word for a rhythm or beat. Like that of an orchestra or your heart. Takt Time describes the regularity of that beat, the time in between each. In production line manufacturing, Takt Time is the rate at which each finished item completes manufacture. At Toyota’s Melbourne plant for example, a Takt Time of 7 minutes would mean that a new finished Camry rolls off the line every 7 minutes.
By understanding Takt Time, a manufacturer is able to run the line at a pace that is in line with demand. Of course it also provides an easy way to work out how long it would take to produce large batches of items. You simply multiply the number of items required by the Takt Time.
You can read more about Takt Time and it’s place in the Toyota Production System here.
This concept becomes useful to our method when Takt Time observed as the rate at which a team completes user stories over time. The time between the completion of successive stories. For our purposes, we want to capture this data in distinct segments, stories per week or per sprint say.
Let’s Begin!
In the example below, I’ve diagramed the delivery pattern of one sprint for a fictitious agile team.
Each story has a Takt Time, rounded to one half day. The first, delivered halfway through day 2, of course has a Takt time of 1.5 days. The next, delivered 1 day later, therefore has a Takt Time of 1 day. Note also the two stories delivered on the last day at the same time. We observe the Takt Times in the same way, one as 2 days (after the story before it) and one as Zero days (after the one delivered at the same time).
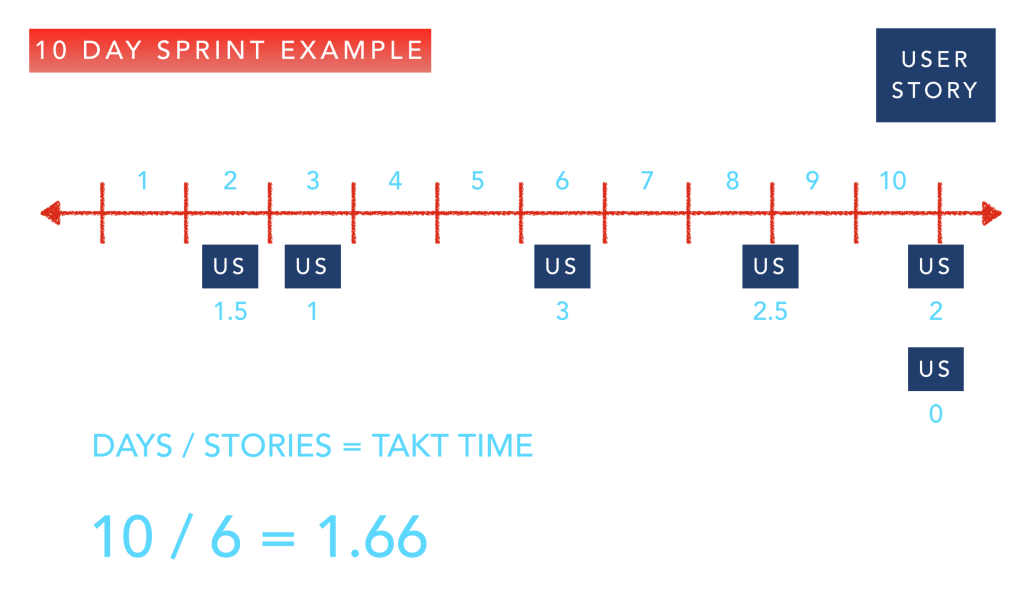
At the end of the sprint, we make note of the average Takt Time (including the Zero!). In this case, 6 stories over 10 days means the sprint Takt Time is 1.66 days.
You see where we’re going ? In order to forecast projects, we simply multiply the number of user stories in the backlog by the Takt Time, right?
Project Duration = Takt Time x Number of User Stories
Ranges
Of course we bloody don’t!
The formula is straight forward, and it’s the right one, but how do we account for the uncertainty of the Takt Time? We can’t simply assume that the team will deliver at that rate consistently in the future.
In How to Measure Anything (Finding the Value of Intangibles in Business), Douglas W. Hubbard argues that building ranges of data is an appropriate means of gaining insight for business decisions. He reasons that attempting to produce a detailed, specific prediction of a business outcome prone to uncertain variables, rarely provides information more valuable for the purpose of decision-making. If the revenue of a $100,000 investment was painstakingly modelled to an assumed benefit of $481,907, would you make a different yes/no decision than you would if you had high confidence in an estimated benefit of “somewhere between$ 400,000 and $600,000”?
To build uncertainty into our model, we’ll mathematically simulate realistic project outcomes, to produce a range of likely delivery dates, each with an assumed level of confidence. That way we can discuss the various decisions that might be made in the event of each. Would our decision to proceed be different if we thought this would take exactly 8 sprints as opposed to (“between 6 and 9 sprints”?
The Takt Time we observed for this sprint is just a sample, a typical example for this team. The next sprint will be different and over time, there’ll be the outliers, large and small. Over the course of 10 sprints, our team’s known Takt samples look like this.
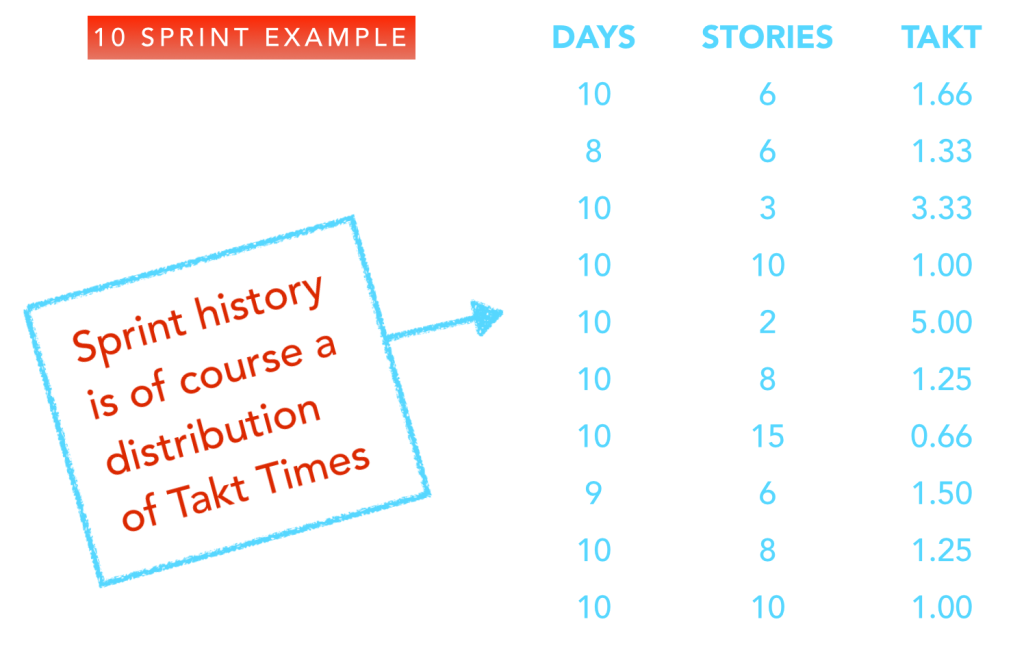
But that range is really no help at all in making a forecast, is it?
Monte Carlo (with Boot strapping)
Mathematic modelling helps people in all sorts of fields answer questions about likely real world outcomes. How do they extrapolate the results of a drug trial to a wider population for example? With even a limited observation of Takt Times, the Monte Carlo method (with Bootstrapping) can help us paint the bigger picture.
The method makes use of the real world data we’ve collected to build reasonable, probable future outcomes. Instead of assuming one consistent Takt Time, it builds a range of thousands and uses that to again build a range of probable delivery forecasts.
Here’s how.
Let’s take five of the Takt Times from the list above. Any five, at random. These are real examples of the time between delivered stories for our team. The sum of those times 5 times is therefore a realistic simulation of the total time to deliver 5 user stories. By dividing that total by the number of inputs, we derive another reasonably assumed sample point.
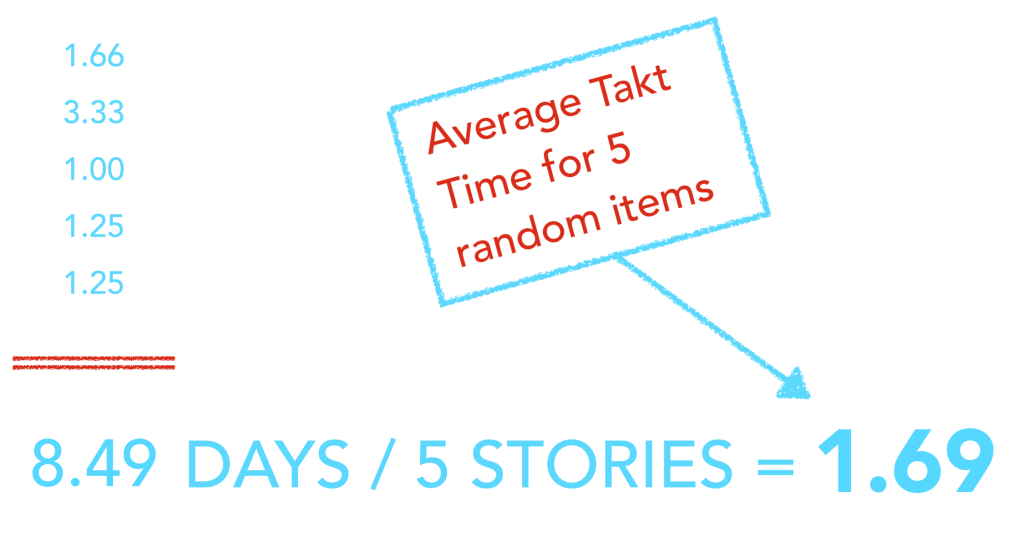
You’ll notice the duplicate in the random sampling. It’s completely reasonable that the team delivers two stories with the same Takt Time in a given period. This means that there are thousands of possible samples of 5 from within our collection. We have thereby been able to bootstrap a model that simulates realistic delivery outcomes.
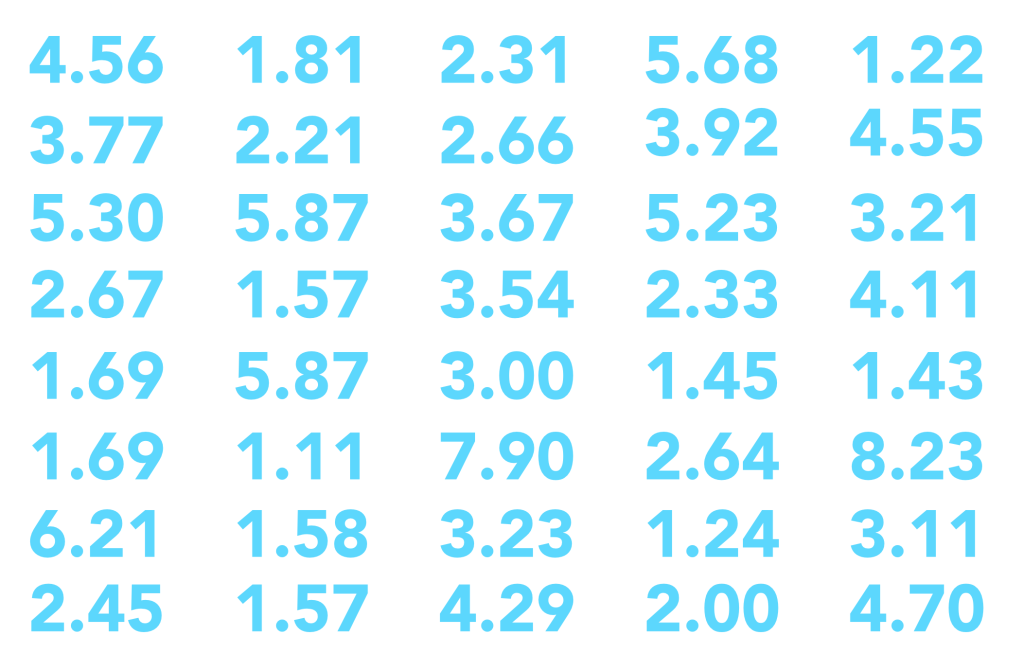
Using a spreadsheet we do just that, assemble a list of 1000 realistic, highly probable Takt Times for the team. This can serve us as a faux history of delivery from which we can derive reasonable project delivery assumptions.
Pulling it all together
The final step is to extend the simulation to a project. This is pretty much a repeat of the randomised selection of Takt Times to produce an acceptable range.
Let’s say our early understanding of the project is that it consists of 35 user stories. We now use the extrapolated range of Takt Times to randomly simulate a delivery time for that number of items. Again, we use a spreadsheet to simulate a 35 user story project, as might be delivered by our team, thousands of times. The resulting distribution is a remarkably interesting and valuable view of delivery possibilities.
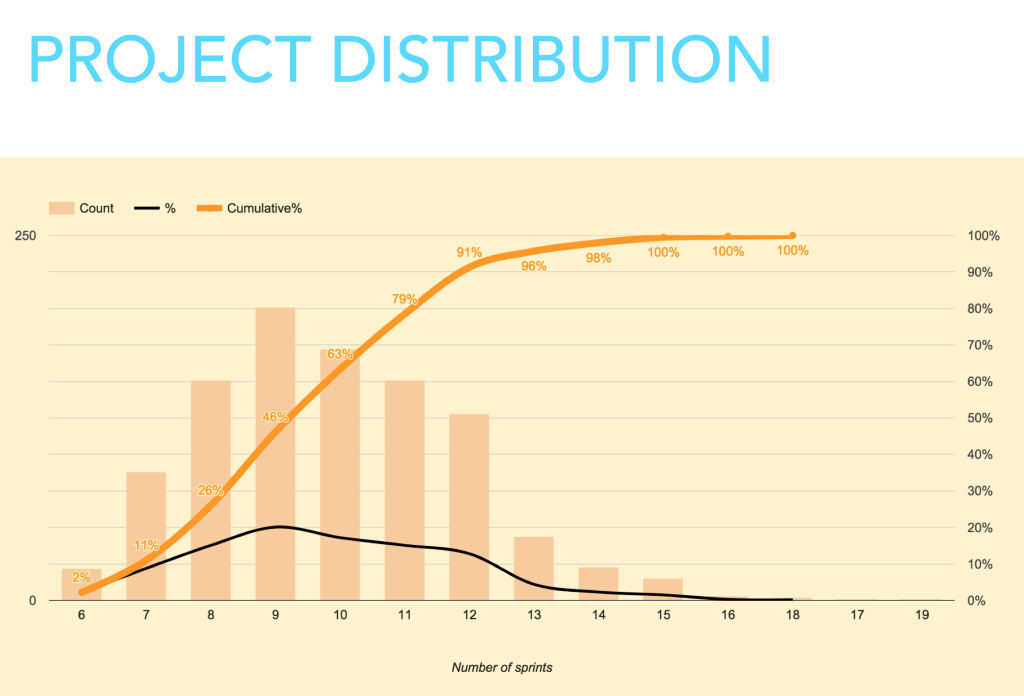
This is what we’ve been mining for. An opinion on the likelihood of a certain delivery schedule that does not rely on the team’s opinion of the effort required, but an observation of the probability of that team delivering a given number of user stories in a given period of time.
We can see that (starting from the left) 2% of the simulations indicated completion in 6 sprints. Not a great level of confidence. As we move right though, accumulated results build. 11% of results come in at 7 sprints (or less). This is distribution is our forecast. We reach the 96% level at 13 sprints.
The level of confidence is a dimension missing from most other methods of estimation. Depending on the cost or the risk involved, we can choose to proceed (or not) at any point on the scale.
In Nutshell
Alright. I know there’s some detail in what I’ve described above, but really the process so far can be summarised as follows:
- Make an observation of a team’s Takt Time over several sprints
As few as 4-5 is enough to get started, and sprints might be weeks if sprints aren’t your thing - Use random samples of that data to generate a simulated range
Bootstrap additional probabilistic typical Takt Times (thousands) for the team. - Sample those simulated Takt times to build a project simulation.
Observe the resulting distribution
Some Notes
I’ve found the Monte Carlo method to be a very useful way of forecasting projects. To close out the post, here are some observations and notes to consider before you try it for yourself.
- It’s a good predictor of the timeline but….
- It relies on a pretty good backlog.
- Stories don’t need to be estimated for size individually but….
- You should be confident that the number of stories is about right
- Teams like it. Monte Carlo removes their ownership (blame/shame) of the forecast but….
- They also like comparing it to what they thought the timeline would be
The Spreadsheet
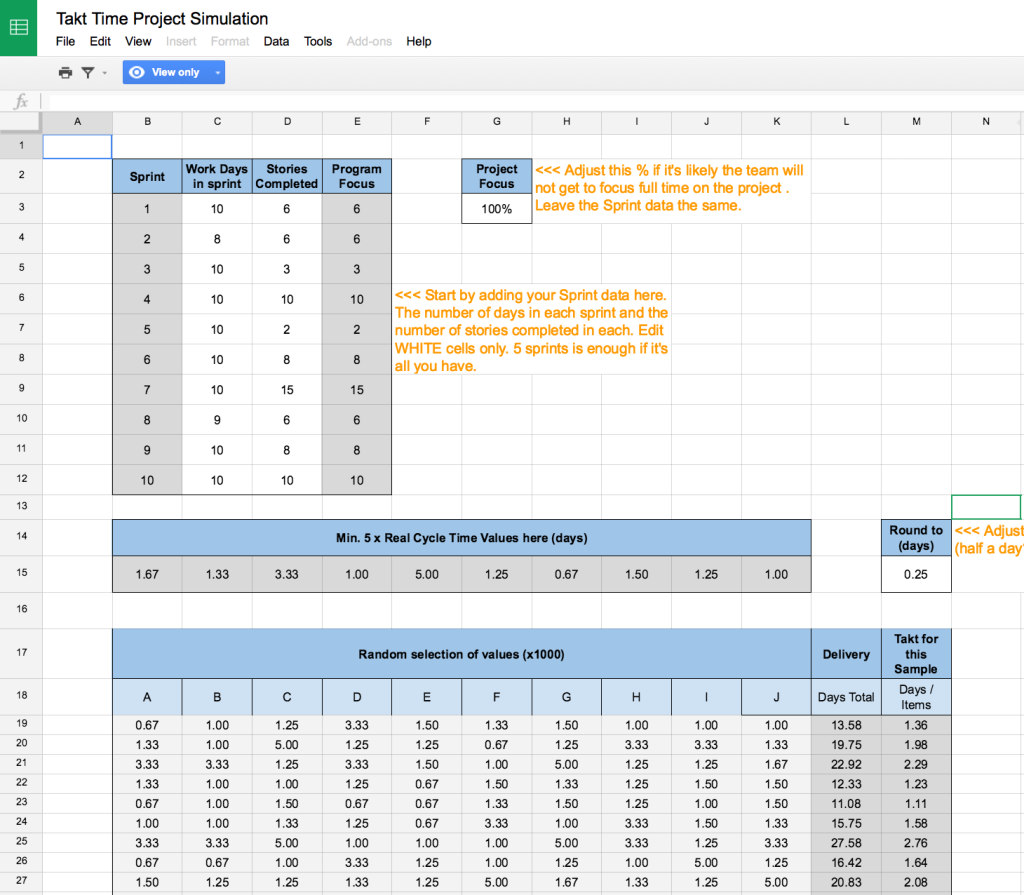
So you’d like to try the Monte Carlo method for yourself? Well of course Scrumage wouldn’t dream of leaving you high and dry without a helping hand!
Here is the spreadsheet I’ve developed to simulate projects with my teams. It’s a Google sheet with instructions and (as with all my charts) you can make a copy and use it as you please.
I’d love some feedback on the post, the sheet and to hear from you about how it goes!
Hi,
Really liking this spreadsheet – thanks for sharing. I have started to use it to help forecast a project we’re just about to kick off.
Quick sanity check on the way we’re using it. We’ve ditched pure Scrum in favour of a Kanban approach (cherrypicking certain Scrum practices where relevant).
* I’ve set the sprint days to 5, to reflect our working week although I am thinking I should change as we’ve had a few bank-holidays.
* The stories completed is just the number of stories – it isn’t reflecting the number of bugs fixed for that period.
* For the project I’m using it for we have a ring-fenced team (roughly 30% of the overall development team) – I know, not true Kanban/Scrum where anybody is able to pick up a ticket but needs must… I’m using the Project Focus input to represent the relevant team size here.
The spreadsheet is set to use data for 10 sprints (or weeks in my case) – does it make any difference adding a larger set than 10 sprints? I can easily grab many weeks worth of data from JIRA. I asked as we’re a relatively small development team and the number of stories completed is impacted by holiday’s etc. I’m assuming this would be factored in by sampling a number of weeks worth of data but August observed a particular slump in productivity – by only going back 10 weeks this will be skewed?
Regards,
Paul
Hi Paul,
Really glad you’re having fun with the sheet. All of the inputs you’re describing sound reasonable to me! The Sprint Days change sprint to sprint to acknowledge any hols in each. You’ll see in my sample data an 8 day and a 9 day sprint.
Include that period where fewer stories were completed! That’s a real sample of the kind of TAKT pattern that’s likely to recur. That’s the point!
The main thing is to discuss the output with the team and anyone else in your organisation interested in delivery dates. It’ll help them to see what life really looks like in delivery land and to adjust their expectations accordingly.
Great post, going to give this a shot!
Love to hear how it goes Paul
I’m wanting to make sure I’m interpreting the Project Distributions data correctly.
In your example spreadsheet, you have shown 10 iterations of data. Your Project Distribution then shows a distribution of the number of iterations the project may take, starting with a 6% chance of the project taking 6 iterations, up to a 100% chance of the project being delivered within 17 iterations.
My questions is, where does this 6 iterations start? Is this 6 iterations after the already 10 iterations of collected data.
e.g. Am I correct in assuming that this is stating that there is a 6% chance of the project being completed in a further 6 iterations (beyond the existing 10 iterations it has already taken), which means there is a 6% chance of the project taking a total of 16 iterations.
I hope my question makes sense.
Thanks,
Daniel
The 10 sprint history used is our example (our input) of what the team’s throughput looks like. The curve represents the number of future sprints that the model returns, assuming a number of user stories. So the 6 sprints is 6 sprints, from the start of a new project.
Brilliant . Cant wait to actually use this. I wonder if we could create a model historically to see how well this model would have predicted for releases gone by. Thanks.
Let me know how it goes!
What about a situation where a team uses story points? Any thoughts on how to modify the spreadsheet to account for the variation in pts per peint as well?
The point of this is to try and remove the subjectivity of the story point as a “measurement”. It doesn’t mean that the work items counted were not estimated in that way, it’s just that w’re not looking to such estimates for a forecast, we’re counting and timing work items completed.
Hi,
Do you have a similar spreadsheet but focusing on Cycle Time and Kanban perspective?
I saw the comments at the top describing from someone using weekly view but I’d like to see if we can do something related to that, and consider a confidence level tied to it… (I’m facing headache already trying to do such implementation :-(.. .that is the reason I’m trying to check if you have anything similar today…
Hi Patrick, I don’t but you might find something like what you need in these agile charting posts.
Hi, I know that this is two years after the question but I’m looking into the Monte Carlo simulation and stumbled across this post and then this question. This recent post, and the (my) spreadsheet referenced at the bottom may be of interest to you.
https://medium.com/@neil2killick/you-dont-need-story-points-1eecd237a39c
Hi Adrian
We just delivered a project over 10 sprints. I plugged our last 10 sprints in (150 stories completed). I have another initiative about the same size we are estimating. When I plug in 150 points under work items on the Project Simulation tab the Project distribution tab says 14% for 10 sprints and 100% for 16 Sprints. Maybe I should just try any 5 random sprints and see the difference?
That’s right Greg, depending on the variation in your data, that’ll happen. It’s not averaging and multiplying that, it’s simulating virtual sprints, by looking at the variable output of your teams, sprint to sprint.
Question. Are the results of the “Project Distribution (Constant)” graph the TOTAL sprints to complete the release or the REMAINING sprints to complete the release? I wonder if each row I enter into the first sheet already counts as completed sprints in this calculation. This seems confusing if this data includes weeks that were from a previous release (ie, the 5 weeks of bootstrap data).
Total, considering the number of work items input.
Great job this thing has got all sorts of things to spin in my head as a true no estimates believer.
I plan to play a lot with this.
short feedback
One thing that puzzled me though was the sprint length before I found it hard coded in a formula.
I think many people would think it would be nice to have the sprint length for the simulation extracted into an input field.
(I have done it in my copy)
I just wanted to know if there is a specific reason for generating 1000 random combinations first and then choose 1000 random samples from the 1000 random combinations?
Wouldn´t it be just as good to use the 1000 random combinations directly?
//Magnus
A great post, very insightful! Comparing the output of this against the alternative agile release burndown (https://www.skylinetechnologies.com/Blog/Skyline-Blog/February-2014/Using-Release-Burndown-for-Agile-Change-Management) makes for a great discussion point, thanks!
I don’t suppose you have an Excel workbook do you? Exporting from Google Docs to .xslx results in tabs being lost and a bounty of errors in Excel 2016.
Cheers
I don’t have an excel version of this Jimmy. I’d love to get a copy if you make one though!
Hi Adfit11,
Great article and spreadsheet!
I have myself used Agile Monte Carlo forecasting with my teams for some time with great result. It is very powerful for aligning around deadlines and communication to stakeholders. Have put togheter below cloud solution that both contains the forecasting part but also Monte Carlo tracking. Would be really grateful if you could give your 5 cent on it!
https://agilemontecarlo.com/home
This calculation relies on the fact that the number of stories and the size per story is constant. A typical product backlog however will have small stories and very big stories that still have to be split up. The more you know about a story the more (smaller) items you get.
How is that taken into account? I need to make assumptions about my future, more unknown items. What I could track is some kind of average split-factor…
Any ideas on that?
great explanation
Thanks for the explanation. Still have a question though. How do you factor in risk management where risks are identified, and made SMART based on their pre and post mitigation efforts?
There is some flaws in your demonstration that prevents it from being mathematically accurate. I see you read Hubbard and that is a great starting point but you should read Savage (The Flaw of Average) to see what I mean. You could also check Vacanti (Actionable Agile) for a better way to achieve what you are demonstrating. The fact that you are building averages over averages gives you at best 50% chance that your simulation is right.
Here are some way you could improve you spreadsheet:
Usage of nb of items done each day instead of Takt time would be best for what you are seeking
Simulating each calendar day using resampling to figure how many stories you will do each day
For each simulation, check on what day you would finish your project given your estimated number of stories for that project
Run the simulation thousands of time
Aggregate the results and check with the stakeholder what risk % he is comfortable with
Choose the duration of the sprints and how many sprints according to the best fit with the simulated date.
And to answer a previous comment, the size of the stories does not matter. That is why this simulation is best suited for that problem. If the size of the stories would be approximately the same, then you would have a normal distribution across story sizes and you would not need to go through all that hassle to get a solid prediction.
Thank you Stephane! It certainly sounds like you know what you’re talking about! So I leave it to the reader to take my version for what it is, a way to help your organisation and teams in making decisions. It is not designed to guarantee a timely outcome or an accurate forecast, but to help you visualise likely team outcomes. I can say that for these purposes, it works well. Further reading and adaption is welcome and advised by Stephane!
Great post! Looks like its a couple of years old now, so thanks for continuing to reply to comments!
I was about to use this to try some predictive modeling on our team when I realized that the model is predicated on knowing an accurate size of the project you’re about to embark on.
In my experience, it’s very difficult to know the project size at the onset. I will try using equivalency sizing, but that seems to fall back on people’s opinion (the very thing we’re trying to avoid!).
Do you have any other suggestions or thoughts on determining project size?
I’m wondering if there’s a way to apply predictive modeling to project sizes if you had sample data of Initial # of User Stories in projects vs the Final # of User Stories when delivered….
Watch your projects over time. Look for a pattern in the rate stories tend to be added over time. Then do your comparative estimate, add your assumed growth and be done. The important thing is to arrive at a range of assumed delivery that you have enough confidence in to be able to proceed or pivot. Never assume this (or any method of estimation) accurately predict the final and precise scope and size of the project. You want to be flexible, you want to add stuff if it makes sense. You want to keep options alive.
Think I might have just accidentally transferred you rspreadsheet to my account. Sorry! let me know if I have and how to transfer it back.
Also – Love your model, super useful for folks like me who don’t have a mathematical bone in their body! One question though: Does time off or time spent working on support tickets (Rather than features) have an impact on the model?
Thank you so much!
One other question…..at the moment I have a team of 10 devs and we want to use your method to predict the deliver of the next release. However, the team is going to split into 2 smaller teams of 5. Do you think your model would still work? Could I use the focus at 50%? Perhaps the model will no longer work as there’s no historoical data for a team of that size? Should we focus both teams on the same release and use MC to predict their outcomes? Some thoughts would be gratefully received. Thank you!!!
I don’t think I’d use it. I’d get started, help the teams collect throughput data and build on that. The two new teams are . . . . . two new teams!
Thought that might be the case. Thank you!
Hi Adfit11, the monte carlo simulation is a great fit for estimating within Kanban: using only a small amount of real data points and then simulating the rest, and you’re demonstration the the google docs is great.
I simply wanted to thank you for doing this!
I am not sure how do you get #no. of stories in your project at any given point of time during you project until the complete backlog is groomed/sliced in to stories ? As some of them might be epics which are not yet groomed and sliced in smaller stories, as complete backlog might not have been groomed at a point of time when we tentatively want to plan for the Release or understand the total scope from Projections perspective. Where as the simulations or data we are collecting(cycle time) is coming from broken down stories of size (1,2,3,5,8,13), where as others which we are considering for #number of total stories in backlog as input may be of size 21 or beyond or some might even be missing as it isn’t broken down.
Relative sizes in S M L XL with some range numbers still make sense with some numbers ? Thoughts ?
This example in the original post is “project based”. In a CD product with no end in sight, I think you could still use this, but instead of the entire “product”, use it for initiatives or large Epics. For example, let’s say your team is building a new micro-service or refactoring a monolith into a new set of API’s. Presumably, you could use this method above, where the total number of stories is restricted to this specific Epic or set of Epics. if you start small on this more limited scale, you should have a reasonable idea of the number of stories, technical items, and probably want to even include a number for inevitable bugs or requirement changes that always occur while it’s being built.
I haven’t personally tried using this yet, but I’m very intrigued by the possibilities and looking forward to playing around with it.
this article and the spreadsheet are awesome! + the talk! just one question, if there is need to give a forecast on a scope (delivered work items) within a strict deadline, how we could modify the spreadsheet? currently we have fixed scope and play with the delivery, could it be possible to play with the scope and have as input a fixed delivery day (e.g scope could be delivered by 13th sprint) thnx!
Just make a copy of the sheet Nikos and have at it. Remember this is a spreadsheet. It works from numbers, so you need to be comfortable allowing a number to represent “scope”, or at least the assumption of how much work might be involved. That’s no science, but a leap of faith that we might accept as useful for providing guidance for decision making.
Hi,
I would like to use your excel sheet for my own calculation but I do have problems to copy the excel file. If I copy them to my Laptop from Google, I get bugs in the formulars and the simulatations (Takt Distribution and Project Distribution to not work correctly). Is there another possiblity to get this excel? Thank you for help and greetings from Germany Oliver
Hi Oliver, it’ll work best if you make a copy within Google sheets and work on that. The charts don’t really translate well to Excel.
Hi Adrian, I do not have a Google account and I am not sure to open one. 😉 Google sheets will not an option for my customer but thank you for the very quick answer. Kind regards, Oliver
Really quick question….your sheet (which is brilliant by the way) needs me to add the number of items in the backlog. Is that the total number of the items in the backlog, or the number of items remaining in the backlog? Thanks!!!!
Depends on what you want to model! If it’s a forecast, then go with remaining (which on day 1 is everything!)
Brilliant, thank you! That’s exactly what I wanted to understand! Then I guess the resultant (forecasting) graph shows how many sprints remain from now through to the point when the backlog is complete….yes?
A range of probable outcomes (how many sprints) – yes.
Does this require to have the all the stories sliced in similar manner? For e.g., each story should take approx 1-3 days and a story which takes more than 3 days should be further sliced into smaller stories.
Definitely recommended. It all starts with great user stories!
Hi Adfit11,
Thank you for this explanation, i just want to know if takt time here is the same that the “cycles times” from kanban ?, and if this forecast using montecarlo works well with just one sptint where normally the scrum master or kanban manager have no mor information when the project start ,but instead taking the average of tasks may be one can use the average of cycle times to simulate?
Ok, so I just started playing around with Monte Carlo projections. I have a few ‘kindergarten’ questions. In the project distribution sheet, what do the legends represent? Count, percentage, and cumulative? I understand that based upon the data I entered and the quantity of backlog items, it is showing me the likely percentages of how many sprints it will take to complete my backlog.
I’m on the cusp of being able to bring this to my team, just need a little more direction.
Thanks
Quick questions:
1. I don’t have all the user stories created yet, but have data for 6 sprints or so. We are expecting more user stories and bugs, tech debt items in the future sprints. Can I run the simulation now , or so I need to wait for scenarios where bugs or tech debts are also processed, before running the simulation?
Hi, thank you for your information, it is inspiring. I am currently working for doing monte carlo simulation of an agile project and am trying to research on what’s the industrial standard of presenting the result. Does it present in P50 , P80 or P90? or Does it always be presented in a range of dates? Thank you in advance.
Greetings, I know this article is a few years old nonetheless I wanted to ask about the monte carlo sheet. I cannot get it to work properly. I even added the sample takt time in the example above and the results are completely different. after i input the data am i supposed to run the simulation? any assistance would be appreciated.
This is a great way to forecast the plan of a project. I am having some problem understanding the the tabs of the google sheet. what is this chart for “Project Distribution – Constant (No Edit)” and”Takt Distribution (No Edit)” How do I understand the charts and reports? Please help !!
HI, Unable to download the spreadsheet. Is the link broken?
You don’t need to download the sheet Lina. Just make copy of the Google sheet.
HI,
I would want have a look at the spreadhseet and try it out. however unable to access it in the provided link. Appreciate if you could share the model.
Just “make a copy” of the google sheet Nagendra
great share
Hi, thanks for this, it demystified a lot of concepts for me. I copied the sheet and managed to decode it and play around with it. Just one question: what is the meaning of the cumulative curve, and does it reflect the level of confidence? So can we say that we have a 96% chance we will need 13 sprints? Or, given that 46% of the simulations (the greatest share) indicate 9 sprints, then 9 sprints is the number we have most confidence in? Thanks!
Hello, its possible doing this simulation using Microsoft Power BI?
This is a much simpler version. I love it. Thanks. I’ve incorporated the logic within my simulation.
I’ve written a python script to perform this logic. The script additionally, reaches out to Jira via their API endpoint to dynamically pull change logs and calculate throughput, historical cycle time distribution, and forecast release dates. It’s open source on GitHub. https://github.com/erudituse/pub-Jira-Monte_Carlo
I’m not a programmer by trade – please feel free to reach out if there are issues.
So it took me 10 years to find this, but I really have found value in this article. If only the spreadsheet were still available!
Still available here Emaly:
https://docs.google.com/spreadsheets/d/1ruJ_YcdEF-CYDjosWGB84EECtW9mqekUPx_kspQnHIs/edit?usp=sharing